-
"The federal budget has entered an unsustainable path, debts are growing faster than the economy. This, by definition, means unsustainability. This does not mean that the current level of debt is unacceptable. It is not. Our ability to service debt is not in question.
We will fix the budget situation in the future. This is best done when the good times are back, the economy is full-time, and taxes start flowing. Now is not the time to prioritize this issue. "
US Federal Reserve Chairman Jerome Powell
-
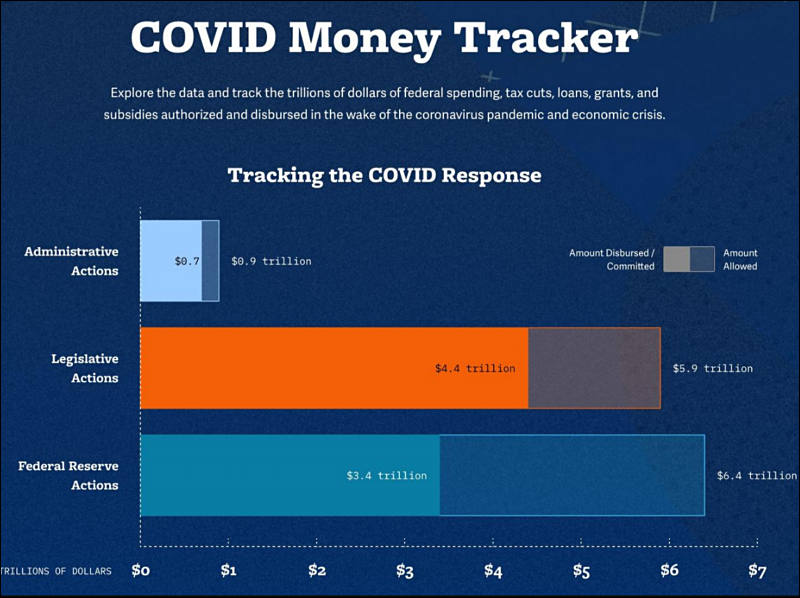
President Biden plans to unveil a plan for American families - the second part of his multibillion-dollar Build Back Better program - ahead of his speech at the 28th Joint Session of Congress.
The new measure is expected to require roughly $1 trillion new spending and about $500 billion in tax breaks.
While details are subject to change, the initiative is likely to be fully funded by a new tax hike aimed at wealthy Americans and investors.
Spending in the plan for American families may be split along the following lines:
- $225 Billion in Paid Family and Medical Leave
- $225 Billion in Child Care Support
- $200 Billion for Universal Early Childhood Education
- "Hundreds of billions" to finance education
- "Other amounts" for nutritional assistance
How soon it will all implode and break, no one knowns, but it is not much time left.
-
I've lost counting...how many trillion' s by now 6 maybe 8 like m&m's... They are not stupid but big corporations are to greedy to see the fall that is patiently awaiting...
-
Prediction for 2025 from analytical firm dealing with defense sales (similar scenery assumed)
- US Population - down 70%
- US Real GDP - down 91%
- US defense budget - down 96%
- US average individual salary purchase power - down 70%
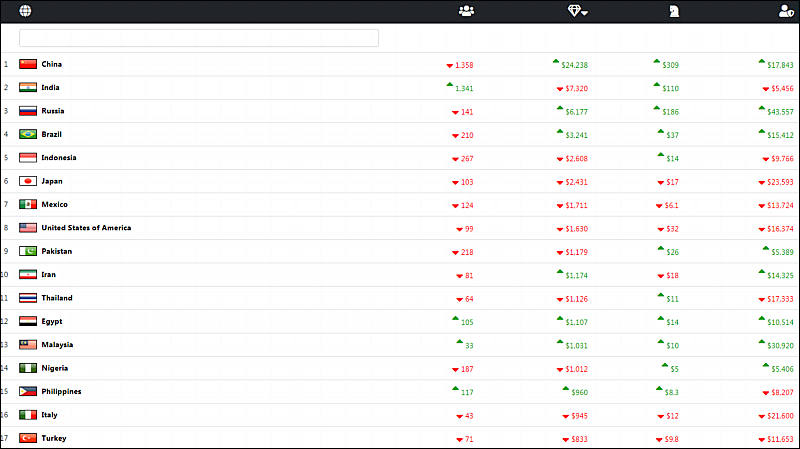
 sa17045.jpg800 x 449 - 53K
 -
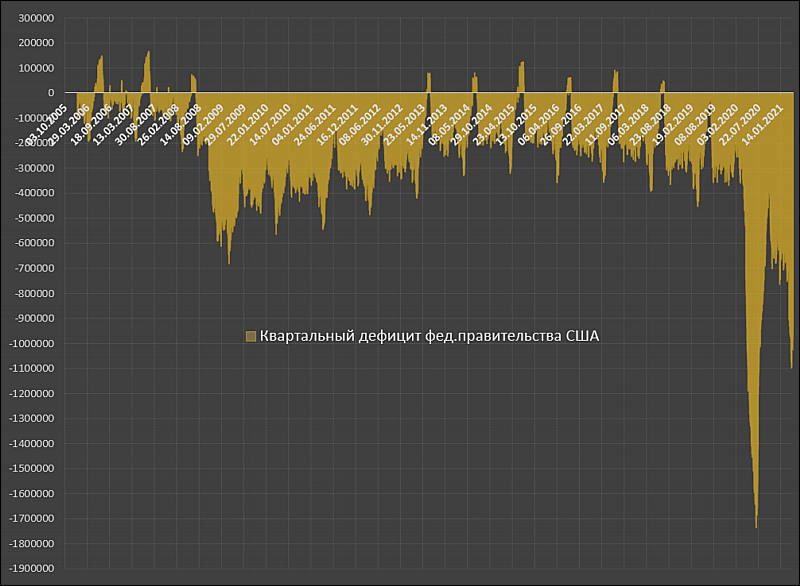
Things are really bad
- Over the past 12 months, the normalized monthly income of the US budget amounted to $ 309.8 billion, and expenses of $ 608.3 billion - or 196% of revenues.
- Adjusted for inflation, normalized budget revenues fell for 12 out of 13 consecutive months, with inflation starting to accelerate.
- The normalized US budget deficit is $ 298.1 billion, which is many times worse than the 2008 collapse.
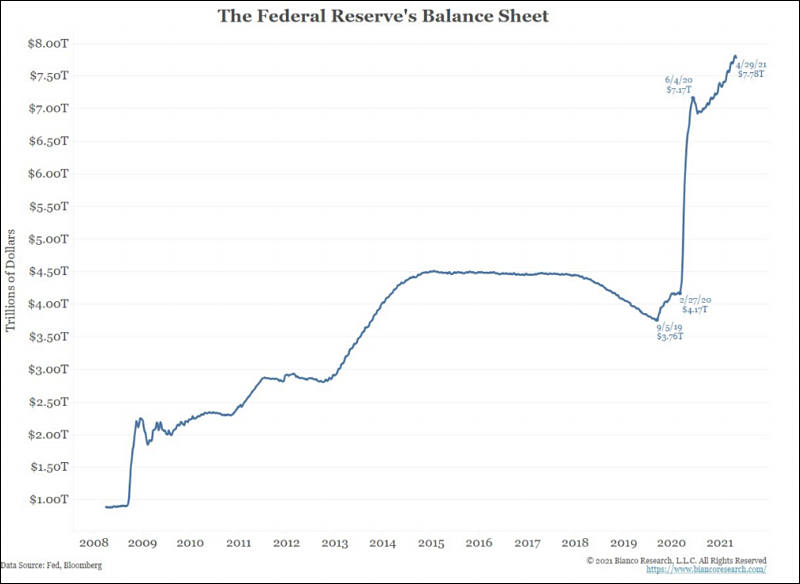
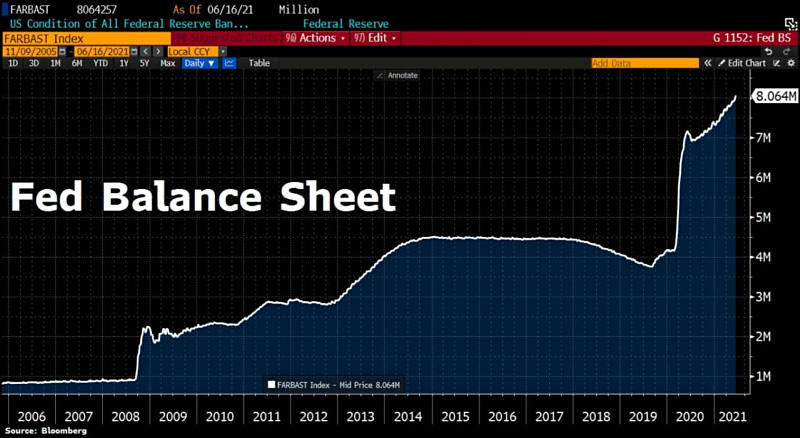
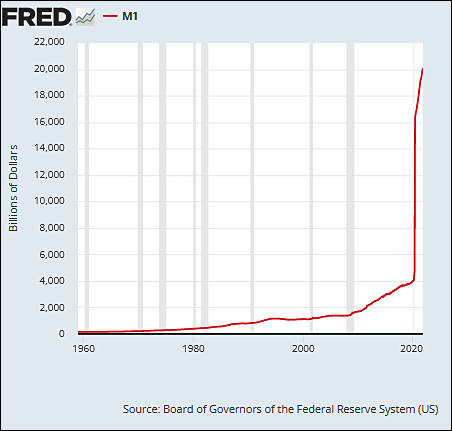
- The size of the US debt pyramid increased from early September 2019 (when the Fed resumed QE) to December 2020 by $ 5716 billion, of which 52% of the increase was covered by the printing press.
- The long-term portion of the pyramid grew by $3124 billion over this period, with 73% being monetized by the printing press. In fact, the market for long-term T-bills ceased to exist and was replaced by the Fed's printing press.
-
Reverse REPO records due to huge money excess in banks
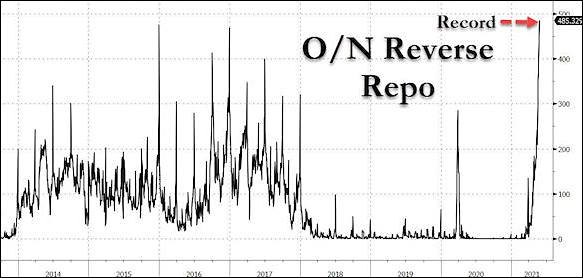
 sa17354.jpg583 x 278 - 30K
 -
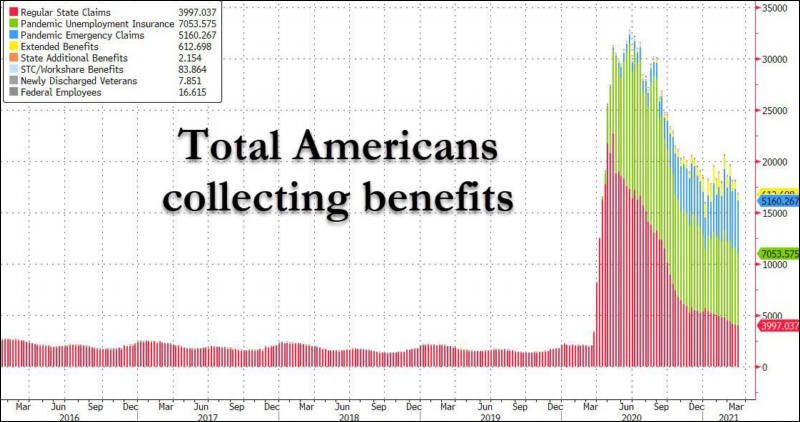
Americans have more debt than ever before.
A surge in credit card spending and home purchases caused US household debt to increase by $313 billion, or 2.1%, in the second quarter, according to the Federal Reserve Bank of New York. That’s the largest nominal jump since 2007 and the biggest percentage increase in seven and a half years.
Overall, U.S. consumers are now $14,960,000,000,000 in debt.
Mortgage debt, the single biggest contributor to overall household debt, rose $282 billion to $10.44 trillion. A whopping 44% of the outstanding balances were originated over the past year, accounting for both new mortgages and refinancings.
-
“Since 1960, the US Congress has increased or suspended the national debt limit about 80 times,” writes US Treasury Secretary Janet Yellen in an article for The Wall Street Journal. “And now he has to do it again. Otherwise, sometime in October - the exact time cannot be predicted - the cash reserves of the Ministry of Finance will become insufficient and the federal government will not be able to pay its bills. "
As the minister emphasizes, America "has always paid the bills on time." And today, according to many economists and experts of the Ministry of Finance, if the United States does not raise the ceiling of the national debt, it threatens the country with a "large-scale economic catastrophe." “In a matter of days, millions of Americans can face cash shortages. Important payments can be postponed indefinitely. Nearly 50 million older people could lose their social security benefits. Troops may stop receiving salaries. Delays in payments can be faced by millions of families who receive a child tax deduction each month. In short, America will not be able to fulfill its obligations, ” - Yellen warns.
Sounds bad.
-
The US Senate on Tuesday supported an increase in the country's national debt ceiling by $ 2.5 trillion, to $ 31.4 trillion.
50 senators voted in support of the initiative, 49 voted against. For its approval, according to the agreements reached earlier by the legislators, it took a simple majority of votes. The Democrats have it both in the Senate and in the House of Representatives.
It is expected that the lower house of the US Congress will also soon approve the specified bill.
-
Excess banking liquidity, which is the fuel for bubbles, increased by $ 2.75 trillion in 2021 (from January to December 15), and by only $ 1.5 trillion in 2020. For all phases QE1, QE2, QE3 from 2009 to 2014, i.e. over 6 years, excess liquidity of banks increased by $ 2.9 trillion. This means that in 2021 alone it was poured into the system comparable to that which was issued from 2009 to 2014 inclusive and about twice as much as in 2020. This is all that you need to know about the stock market this year.
How did it come about if the volume of QE is only 120 billion a month? The reason is the dissolution of the US Treasury reserves, which by December 15 fell to 50 billion in the Fed's accounts.
In 2022, they will have to borrow about 2.7 trillion, where 2.2 trillion is at least financing the budget deficit, according to the most conservative estimates, and 500 billion is the normalization of US Treasury reserves. Let me remind you that at the beginning of 2021 they reached 1.8 trillion and, according to the plans, they should balance about 500-600 billion.
-
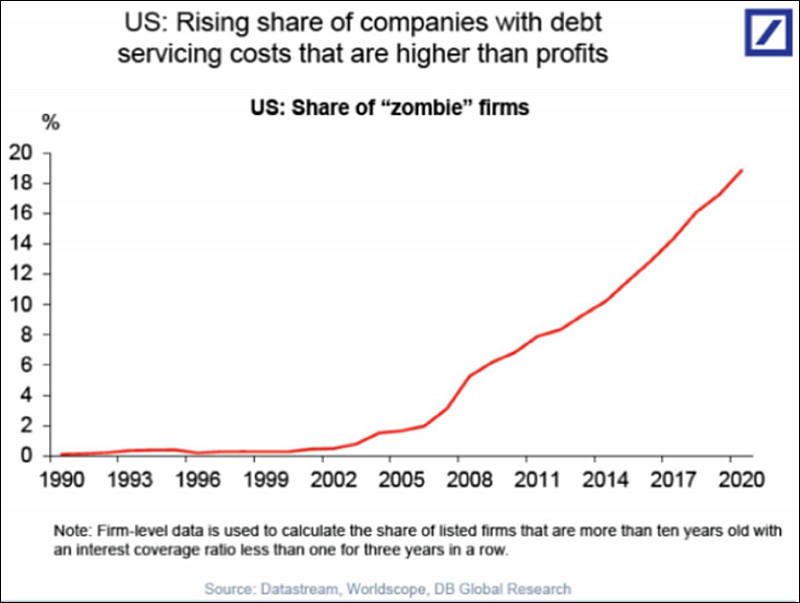
The outlook for the stock market, in particular, and the global financial system in general, has never been so dire as it was in December 2021. The scale of imbalances in the system reaches critical, borderline values. This primarily concerns the exorbitant levels of debt burden, in which market debt is traded in a persistently negative area in terms of real yields, which blocks a stable cash flow to cover the issue of new debt securities and refinancing of existing ones, with the exception of directive structures (Central Bank, primary dealers, insurance and pension funds). In the current reality and configuration of the financial system in the presence of a stable negative zone of real interest rates, effective debt build-up is IMPOSSIBLE without QE. And the continuation of QE is impossible, since increases inflationary pressures, market bubbles and debt imbalances. Normalization of interest rates is also impossible, since rising interest rates will simply wipe out debt issuers because of unacceptable debt service levels that consume all of the cash flow. A zombie economy that has been consistently degrading for 10 years - that's what it is.
-
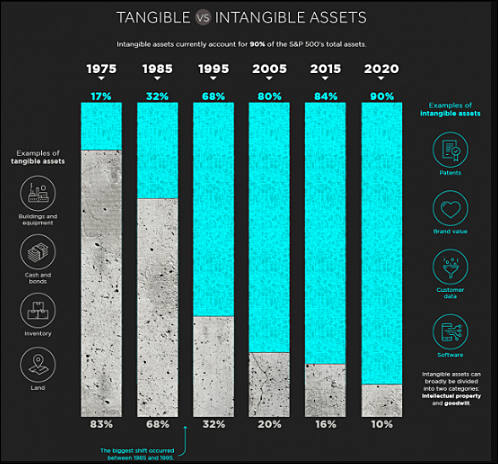
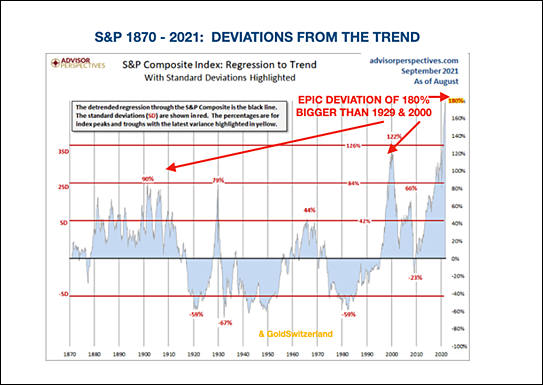
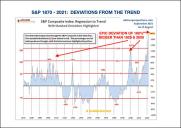
As of today, the U.S. has seen three great asset bubbles in 25 years, far more than normal. I believe this is far from being a run of bad luck, rather this is a direct outcome of the post-Volcker regime of dovish Fed bosses. It is a good time to ask why on Earth the Fed would not only have allowed these events but should have actually encouraged and facilitated them.The fact is they did not “get” asset bubbles, nor do they appear to today. This avoidance of the issue seemed to us remarkable as long ago as the late 1990s. Alan Greenspan, who I considered then and now to be dangerously incompetent, famously acted as cheerleader in the formation of the then greatest equity bubble by far in U.S. history in the late 1990s and we all paid the price as it deflated.
Bernanke should have been wiser from the experience of this bubble bursting and the ensuing pain, and he might have moved against the developing housing bubble – potentially more dangerous than an equity bubble as discussed. No such luck! It is pretty clear that Bernanke (and Yellen) were such believers in market efficiency that in their world bubbles could never occur.This is old territory for me, but I have to admit to enjoying it. Back then, when confronted with a clear 3-sigma event in the U.S. housing market, Bernanke insisted that “the U.S. housing market merely reflects a strong U.S. economy,” and that “the U.S. housing market has never declined.” The information he meant to deliver was unsaid but clear: “and it never will decline because there is no bubble and never can be.”
On a purely statistical basis, the history of U.S. house prices had indeed never bubbled before, being so diversified collectively – booming in Florida while coasting in Chicago and falling in California. Until, that is, the sustained excess stimulation of the Greenspan and Bernanke era created a perfect opportunity to finally boom in every region together. And what of the Fed’s statisticians? Picked for either their thick academic blinders or intimidated by the usual career risk we all know and love so well – don’t deliver information your boss doesn’t want to hear – they were totally silent or ineffective.Whereupon the unprecedented and apparently non-existent housing bubble retreated all the way back to its trend that had existed prior to the bubble, and then quite typically for a bubble, went well below. So, the 3-sigma event came and went, the best looking, most well-behaved bubble of all time (see Exhibit 3), causing profound economic damage to the U.S. and global economies, particularly because of the lack of regulation around the new mortgage-related instruments. Thus, the Fed had for the second time aided and abetted a great bubble forming. And this time the pain was augmented by the housing bust, associated mortgage mayhem, and the ensuing decline in the U.S. stock market – merely badly overpriced but not a bubble – with the combined loss of “perceived wealth” threatening a depression and necessitating an unprecedented bailout and massive, but rather inept, stimulus. Yet, when society looked around to assign blame and process lessons learned, it was as if it tried very hard to miss the point.
Perhaps the most important longer-term negative of these three bubbles, compressed into 25 years, has been a sustained pressure increasing inequality: to participate in the upside of an asset bubble you need to own some assets and the poorer quarter of the public owns almost nothing. The top 1%, in contrast, own more than one-third of all assets. And we can measure the rapid increase in inequality since 1997, which has left the U.S. as the least equal of all rich countries and, even more shockingly, with the lowest level of economic mobility, even worse than that of the U.K., at whom we used to laugh a few decades back for its social and economic rigidity. This increase in inequality directly subtracts from broad-based consumption because, on the margin, rich people getting richer will spend little to nothing of the increment where the poorest quartile would spend almost all of it.So, here we are again. This time with world record stimulus from the housing bust days, followed up by ineffably massive stimulus for Covid. (Some of it of course necessary – just how much to be revealed at a later date.) But everything has consequences and the consequences this time may or may not include some intractable inflation. But it has already definitely included the most dangerous breadth of asset overpricing in financial history. At some future date, when pessimism rules again as it does from time to time, asset prices will decline. And if valuations across all of these asset classes return even two-thirds of the way back to historical norms, total wealth losses will be on the order of $35 trillion in the U.S. alone.5 If this negative wealth and income effect is compounded by inflationary pressures from energy, food, and other shortages, we will have serious economic problems.
https://www.gmo.com/europe/research-library/let-the-wild-rumpus-begin/


Howdy, Stranger!
It looks like you're new here. If you want to get involved, click one of these buttons!
Categories
- Topics List23,993
- Blog5,725
- General and News1,354
- Hacks and Patches1,153
- ↳ Top Settings33
- ↳ Beginners256
- ↳ Archives402
- ↳ Hacks News and Development56
- Cameras2,368
- ↳ Panasonic995
- ↳ Canon118
- ↳ Sony156
- ↳ Nikon96
- ↳ Pentax and Samsung70
- ↳ Olympus and Fujifilm102
- ↳ Compacts and Camcorders300
- ↳ Smartphones for video97
- ↳ Pro Video Cameras191
- ↳ BlackMagic and other raw cameras116
- Skill1,960
- ↳ Business and distribution66
- ↳ Preparation, scripts and legal38
- ↳ Art149
- ↳ Import, Convert, Exporting291
- ↳ Editors191
- ↳ Effects and stunts115
- ↳ Color grading197
- ↳ Sound and Music280
- ↳ Lighting96
- ↳ Software and storage tips266
- Gear5,420
- ↳ Filters, Adapters, Matte boxes344
- ↳ Lenses1,582
- ↳ Follow focus and gears93
- ↳ Sound499
- ↳ Lighting gear314
- ↳ Camera movement230
- ↳ Gimbals and copters302
- ↳ Rigs and related stuff273
- ↳ Power solutions83
- ↳ Monitors and viewfinders340
- ↳ Tripods and fluid heads139
- ↳ Storage286
- ↳ Computers and studio gear560
- ↳ VR and 3D248
- Showcase1,859
- Marketplace2,834
- Offtopic1,320


