It allows to keep PV going, with more focus towards AI, but keeping be one of the few truly independent places.
-
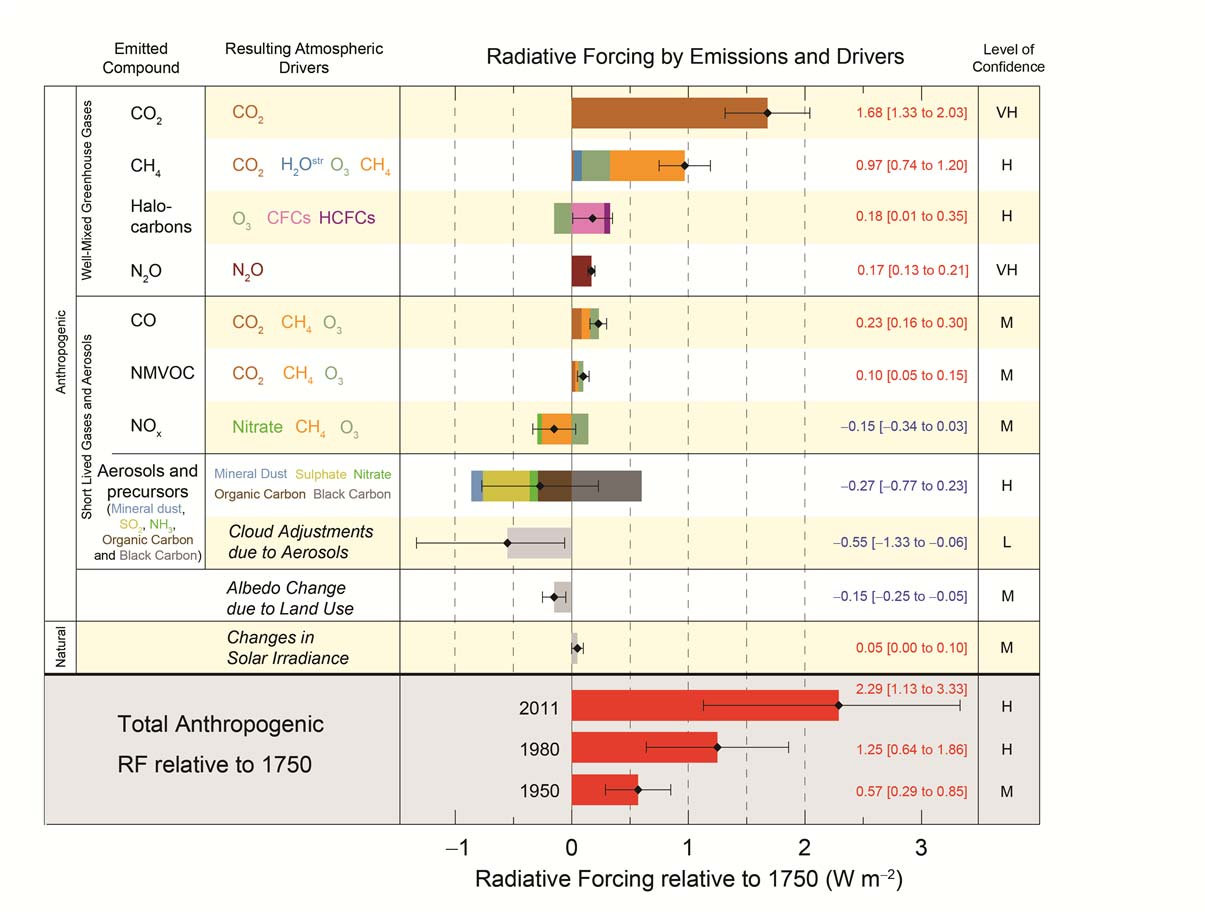
Despite media announcements of what's to be included in the report, the Final Draft of the Working Group I contribution to the IPCC Fifth Assessment Report won't be available until 30 September at http://www.ipcc.ch/
-
What is interesting in the report no one saw yet? Or they changed global warming to global freezing already?
-
The report is to be released today (GMT, I suppose) and will be downloadable some time during the next few hours:
http://www.ipcc.ch/report/ar5/wg1/
According to the Technical Summary and Press releases, it promises to be a long read.
- Introduction
- Observations: Atmosphere and Surface
- Observations: Ocean
- Observations: Cryosphere
- Information from Paleoclimate Archives
- [Carbon and Other Biogeochemical Cycles]9
- Clouds and Aerosols
- Anthropogenic and Natural Radiative Forcing
- Evaluation of Climate Models
- Detection and Attribution of Climate Change: from Global to Regional
- Near-term Climate Change: Projections and Predictability
- Long-term Climate Change: Projections, Commitments and Irreversibility
- Sea Level Change
- Climate Phenomena and their Relevance for Future Regional Climate Change
-
Can't think of a more discredited body than the IPCC.
-
If your browser doesn't show the download link*, here it is (I think):
http://www.climatechange2013.org/images/uploads/WGIAR5-SPM_Approved27Sep2013.pdf
The page only worked on one of my five browsers (Linux). The page's HTML doesn't validate well with W3C. I wonder if scientists were too busy to employ a developer?

-
I've finally found the full, 2,500-page draft final report (158MB) at http://www.climatechange2013.org/images/uploads/WGIAR5_WGI-12Doc2b_FinalDraft_All.pdf
This is one of those times when modern media cannot cope: they showed far more activity after press releases and minor leaks before publication. Post publication, (well, ya have to do some readin before ya can write anythin', don't ya?).
How can the complexities of climate science be condensed into bite-size morsels for public, and political, consumption?
-
Despite the original forecasts, major climate research centres now accept that there has been a “pause” in global warming since 1997
Professor Anastasios Tsonis, of the University of Wisconsin, said: "We are already in a cooling trend, which I think will continue for the next 15 years at least. There is no doubt the warming of the 1980s and 1990s has stopped.”
LOL
-
... 1998 represented an abnormally hot year at the Earth's surface due to one of the strongest El Niño events of the 20th century. Thus it represents a poor choice of a starting date to analyze the surface warming trend (selectively choosing convenient start and/or end points is also known as 'cherry picking'). For example, we can select a different 15-year period, 1992–2006, and find a surface warming trend nearly 50 percent faster than the multi-model average, as statistician Tamino helpfully illustrates in the figure below.

Global surface temperature data 1975–2012 from NASA with a linear trend (black), with trends for 1992–2006 (red) and 1998–2012 (blue).

In short, if David Rose wasn't declaring that global surface warming was accelerating out of control in 2006, then he has no business declaring that global surface warming has 'paused' in 2013. Both statements are equally wrong, based on cherry picking noisy short-term data.
from http://www.skepticalscience.com/ipcc-model-gw-projections-done-better-than-you-think.html
Howdy, Stranger!
It looks like you're new here. If you want to get involved, click one of these buttons!
Categories
- Topics List23,998
- Blog5,725
- General and News1,360
- Hacks and Patches1,153
- ↳ Top Settings33
- ↳ Beginners256
- ↳ Archives402
- ↳ Hacks News and Development56
- Cameras2,367
- ↳ Panasonic995
- ↳ Canon118
- ↳ Sony156
- ↳ Nikon96
- ↳ Pentax and Samsung70
- ↳ Olympus and Fujifilm101
- ↳ Compacts and Camcorders300
- ↳ Smartphones for video97
- ↳ Pro Video Cameras191
- ↳ BlackMagic and other raw cameras116
- Skill1,960
- ↳ Business and distribution66
- ↳ Preparation, scripts and legal38
- ↳ Art149
- ↳ Import, Convert, Exporting291
- ↳ Editors191
- ↳ Effects and stunts115
- ↳ Color grading197
- ↳ Sound and Music280
- ↳ Lighting96
- ↳ Software and storage tips266
- Gear5,420
- ↳ Filters, Adapters, Matte boxes344
- ↳ Lenses1,582
- ↳ Follow focus and gears93
- ↳ Sound499
- ↳ Lighting gear314
- ↳ Camera movement230
- ↳ Gimbals and copters302
- ↳ Rigs and related stuff273
- ↳ Power solutions83
- ↳ Monitors and viewfinders340
- ↳ Tripods and fluid heads139
- ↳ Storage286
- ↳ Computers and studio gear560
- ↳ VR and 3D248
- Showcase1,859
- Marketplace2,834
- Offtopic1,320
Tags in Topic
- global 5
- warming 2
- greenhouse 1


